Displaying our "R - Quality Control Individual Range Chart Made Nice" inside a Java web App using AJAX - How To.
- Prerequisites:
- What you should have installed:
- Java, it can be OpenJDK, you can get it from here: https://github.com/ojdkbuild/ojdkbuild
- Tomcat, any version from 8 up.
- Eclipse EE: Eclipse IDE for Java EE.
- Spring Tools Suite For Eclipse: https://spring.io/tools. You can install it from Eclipse Marketplace.
- R: https://www.r-project.org. Inside R, at least these packages:
- install.packages( "tidyverse", dependencies = TRUE )
- install.packages( "rmarkdown", dependencies = TRUE )
- install.packages( "dygraphs", dependencies = TRUE )
- install.packages( "qcc", dependencies = TRUE )
- install.packages( "rattle", dependencies = TRUE )
- install.packages( "Rcmdr", dependencies = TRUE )
- install.packages( "stlplus", dependencies = TRUE )
- Rstudio, to edit your RMarkdown files: https://www.rstudio.com.
- Rtools: https://cran.r-project.org/bin/windows/Rtools/index.html.
- Pandoc, this is to convert markdown files to html: https://pandoc.org.
- Fork git utility: https://git-fork.com. This is optional but it might be easier the job of downloading the projects from github.com: https://github.com/LaranIkal/R-ANALYTICS And https://github.com/LaranIkal/rchart.
- Knowledge of:
- Java web development with Spring.
- Ajax, at least the concept.
- Thymeleaf, at least the template concept: https://www.thymeleaf.org.
- R and the R related tools mentioned above.
- SPC, it is important for you to read my article: R - Quality Control Individual Range Chart Made Nice.
- Once you are ready with all mentioned above, it is important you are able to generate the html file on your computer from the RMarkdown file provided on the github repository( https://github.com/LaranIkal/R-ANALYTICS ) mentioned above by using RStudio.
- Download the zip file: R-ANALYTICS-master.zip
- Unzip it to a local folder.
- Double-click on file: R-ANALYTICS.Rproj, it will start rstudio.
- On the right-below pane, click on files, you will see your files, click on file name: QualityControl_IndividualRangeChart.Rmd, rstudio will open the file:

- To generate the html file from the Rmarkdown file, click on Knit->Knit to HTML.

- Now you should be able to see your Intermediate Range Chart html file, like this:

- Now you must be able to generate the html file from command line, if you are on windows, the command would be like this:
"C:\Program Files\R\R-3.5.1\bin\Rscript" -e "rmarkdown::render('C:/Development/R/R-ANALYTICS/QualityControl_IndividualRangeChart.Rmd')"
Maybe the path to Rscript and the path to the Rmd file is different, just change it as you have it on your computer.
Note. It is important to note that this project was created using Windows 10 and it works on a Windows server as well.
- The next step is to get the files from master repository on github: https://github.com/LaranIkal/rchart.git, or you can also go directly to: https://github.com/LaranIkal/rchart and download the zip file, it will download a file called: rchart-master.zip
- Creating the project in eclipse EE IDE:
- Using your file explorer, create a folder called rchart inside your eclipse EE workspace folder.
- Open file rchart-master.zip
- Extract the content of rchart-master folder inside the zip file into the new rchart folder you just created.
- Start Eclipse EE IDE and go to File-New-Java Project:.

- Enter the name of the project as rchart and click Finish:

- Once the project has been added, open it and double click on your pom.xml file to edit the Tomcat path according to your Tomcat path and save your changes:

- Right-Click on your pom.xml file and Select Run As -> Maven build:

- When Eclipse asks to edit the launch configuration, enter eclipse:eclipse as the Goals and click Run:

This will update all dependencies for the project.
- Now let's create the war file, Right-Click on your pom.xml file and Select Run As -> Maven install:

This should generate a war file under your Tomcat installation folder/webapps, when you run the file Tomcat installation folder/bin/startup.bat, the war file must be expanded, so you will see something like this:

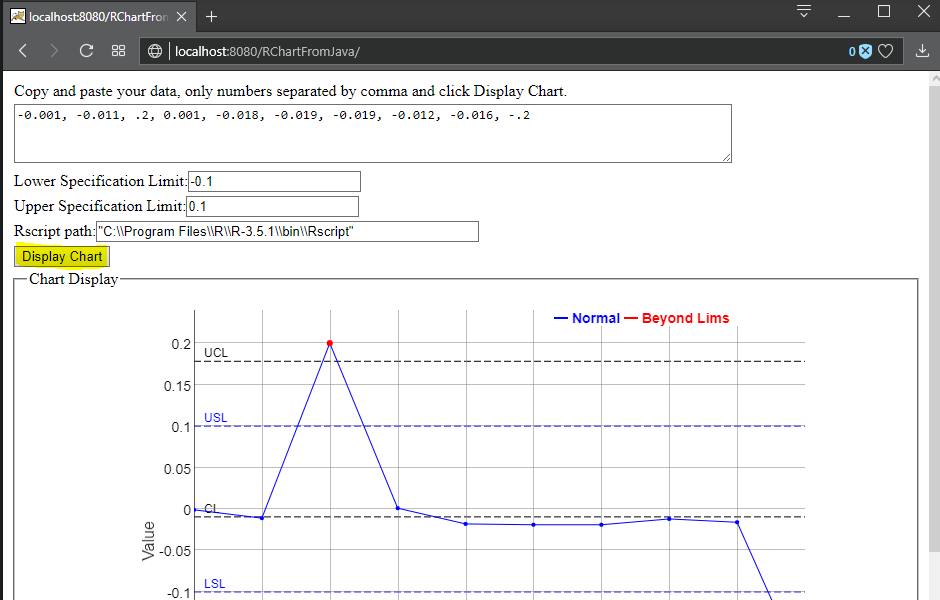
- Go to your web browser and point it to http://localhost:8080/RChartFromJava, verify the Rscript path and set it accordingly - "C:\\Program Files\\R\\R-3.5.1\\bin\\Rscript" - and click on the Display Chart button, now you should be able to see the Intermediate Range Chart of the data in the text area:
How is it working?:
- When you point your web browser to: http://localhost:8080/RChartFromJava, the MainController Java file sends the homepage.html template to the browser, the homepage.html loads the Javascript file DisplayChart.js under folder rchart\src\main\resources\static
- When you click the Display Chart button, it runs the Javascript code because it is configured in this way in the template: <input type="button" VALUE="Display Chart"
onclick='JavaScript:xmlhttpPostScriptData( "DisplayChart", this.form, "iframeChartDisplay", "Display Chart" )'>, the Javascript code posts the data to the Java backend app using Ajax and keeps waiting for response.
- The MainController in the Java backend app receives the data and opens the RMarkdown template under folder: rchart\src\main\resources\static\ChartTemplates, it replaces the values and creates a temporary RMarkdown document, then it process the RMarkdown temporary document to create the html document, opens the html file and return it as string to the web browser.
If you have any questions, I might help you if you let a comment in this article.
Enjoy it!!!.
Carlos Kassab
https://www.linkedin.com/in/carlos-kassab-48b40743/
More information about R:
https://www.r-bloggers.com
Carlos Kassab
https://www.linkedin.com/in/carlos-kassab-48b40743/
More information about R:
https://www.r-bloggers.com

